
Charts, Tables, & Graphs
Graph shows steady climb in AIDS cases between 1981 and 1987. In late 1985, the death rate began to slow down but remained high
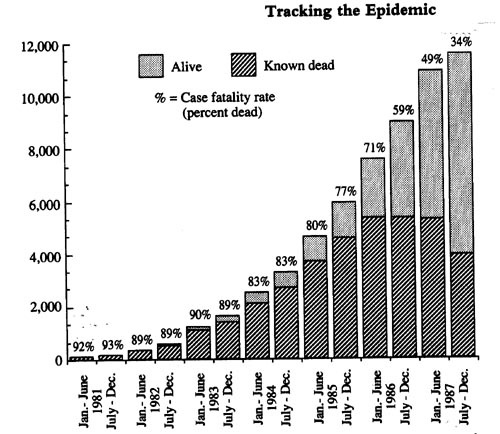
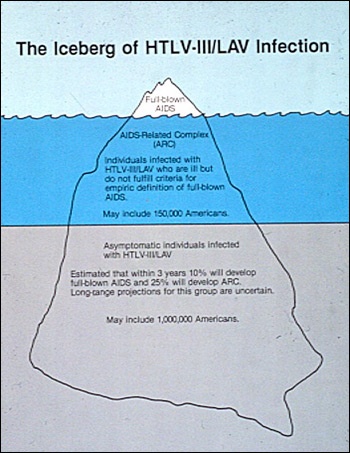
Because AIDS symptoms can take 10 years to develop, only a small fraction of the epidemic was visible in 1985
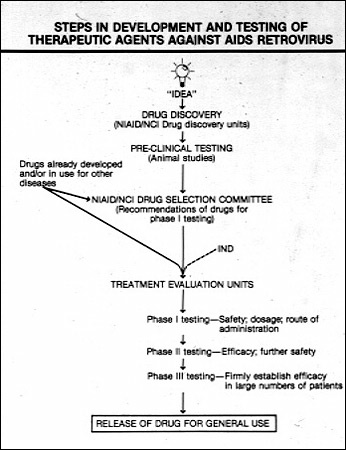
Developing a treatment for HIV/AIDS involves numerous steps
Overview
Content Tools
ThemeBuilder