
...
- Lewis Lipkin: optical microscopy of serial brain sections and macrophage motility measurements with asbestos
- Peter Lemkin: bone marrow smear analysis, 2D gel electrophoresis
- Bruce Shapiro: RNA secondary structure of electron micrograph
- Carl Merril: NIMH/NIH - 2-dimensional (2D) gel electrophoresis, E.coli mutants and macrophages with asbestos
- Jacob Maizel: NICHD/NIH, with Bruce Shapiro - RNA electron microscopy of secondary structure
- Eric Lester: NCI, U. Chicago, and oncology practice - 2D gel electrophoresis on human leukemia
- Steve Aley and Russell Howard: NIAID/NIH - 2D gel electrophoresis of Plasmodium knowlesi clones
- Peter Wirth and Snorri Thorgeirsson: NCI/NIH - 2D gel electrophoresis on liver cell lines
- Peter Sonderegger: NICHD/NIH and U. Zurich - 2D gel electrophoresis of axonal proteins of sensory and motor neurons
| Div | ||||||||||
|---|---|---|---|---|---|---|---|---|---|---|
| ||||||||||
|
| Div | ||||||||||
|---|---|---|---|---|---|---|---|---|---|---|
| ||||||||||
|

...
| Anchor | ||||
|---|---|---|---|---|
|
| Div | ||||||||||
|---|---|---|---|---|---|---|---|---|---|---|
| ||||||||||
|

Anchor RTPP-Quantimet-PDP8e-blockDiagram RTPP-Quantimet-PDP8e-blockDiagram
| Div | ||||||||||
|---|---|---|---|---|---|---|---|---|---|---|
| ||||||||||
|

...
Anchor ControlDesk ControlDesk
| Div | ||||||||||
|---|---|---|---|---|---|---|---|---|---|---|
| ||||||||||
|

...
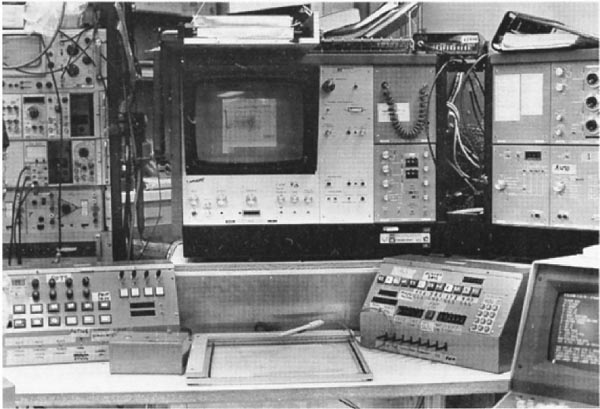
Anchor PhotoRTPPandConsole PhotoRTPPandConsole
...
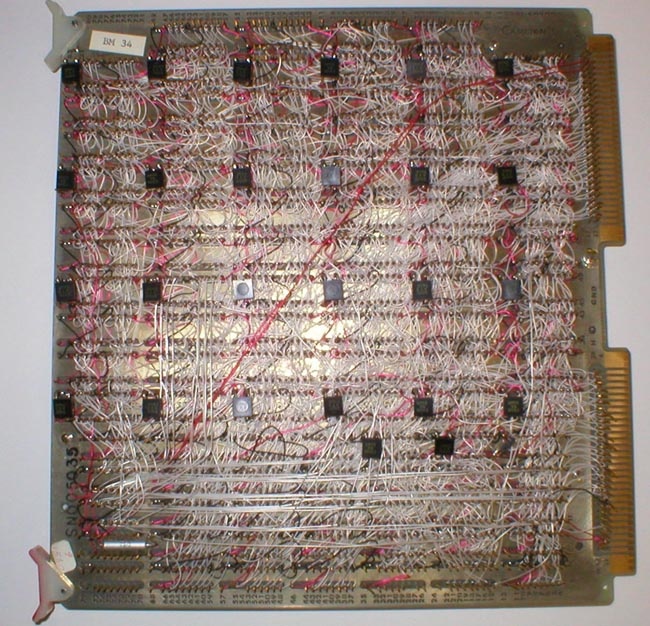
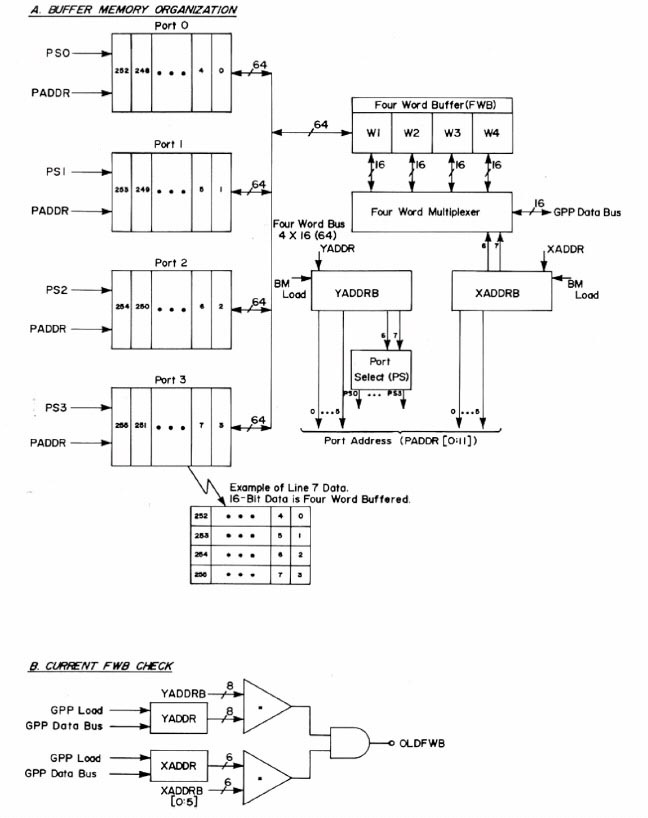
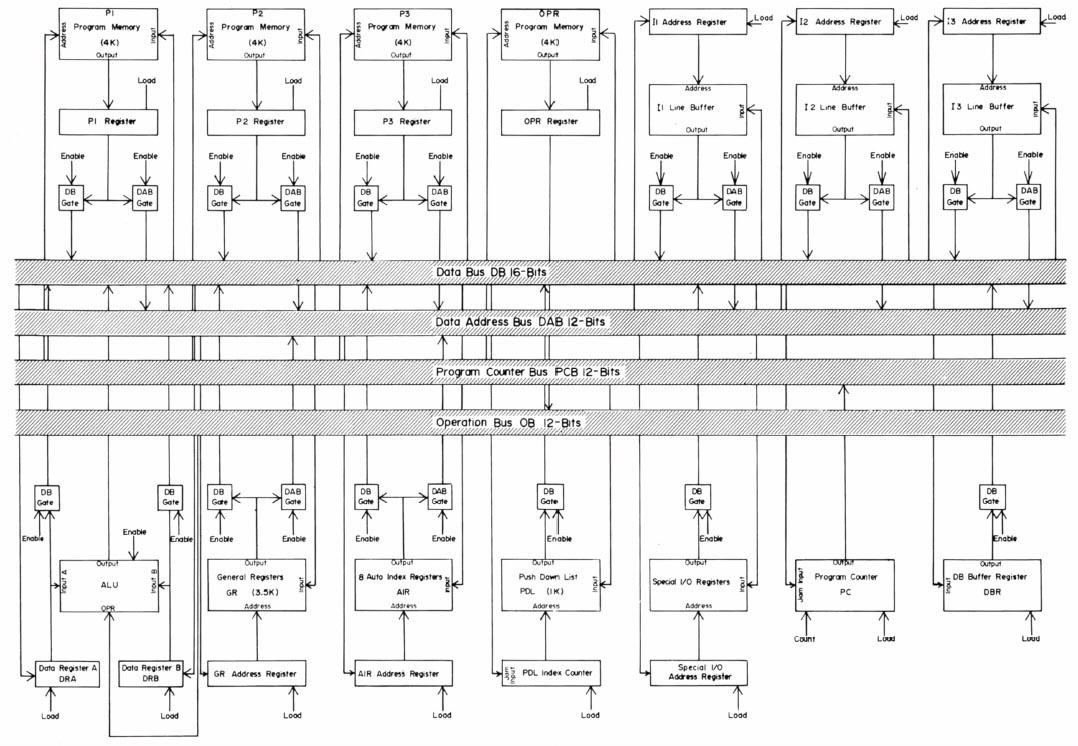
During this time, we had the conviction, led by Lew Lipkin and George Carman, that anything that we wanted to be do in software could be done by a series of sequential gates. These could be proved Boolean algebraically correct using Karnaugh Maps![]() , hardware finite state machines, and related techniques. George had just taken a microprogramming design course as part of his masters degree in computer hardware architecture and the design of buffer memories and the General Picture Processor (GPP) were perfect test beds in which to try out these new design principles which were relatively new for projects like this. Some of the design diagrams are shown in Figures 11 through 14 (from the Carman [4] paper). Figure 15 shows some examples of GPP microprogrammed instructions for manipulating the buffer memory data. The design was further described in some of the technical reports [TR-7, TR-7a, TR-16, TR-21, TR-21b, TR-22] listed at the end of this history. Because we were prototyping the system, the card was constructed using wire wrapping rather than multilayer printed circuit boards. A commercial version would have used printed circuit boards, but would only have been economically feasible if many copies of the RTPP were produced. Using complex multi-level printed circuit boards is generally too expensive for a research lab.
, hardware finite state machines, and related techniques. George had just taken a microprogramming design course as part of his masters degree in computer hardware architecture and the design of buffer memories and the General Picture Processor (GPP) were perfect test beds in which to try out these new design principles which were relatively new for projects like this. Some of the design diagrams are shown in Figures 11 through 14 (from the Carman [4] paper). Figure 15 shows some examples of GPP microprogrammed instructions for manipulating the buffer memory data. The design was further described in some of the technical reports [TR-7, TR-7a, TR-16, TR-21, TR-21b, TR-22] listed at the end of this history. Because we were prototyping the system, the card was constructed using wire wrapping rather than multilayer printed circuit boards. A commercial version would have used printed circuit boards, but would only have been economically feasible if many copies of the RTPP were produced. Using complex multi-level printed circuit boards is generally too expensive for a research lab.
| Anchor | ||||
|---|---|---|---|---|
|
| Div | ||||||||||
|---|---|---|---|---|---|---|---|---|---|---|
| ||||||||||
|

...
Anchor TMS4030chip TMS4030chip
| Div | ||||||||||
|---|---|---|---|---|---|---|---|---|---|---|
| ||||||||||
|

| Div | ||||||||||
|---|---|---|---|---|---|---|---|---|---|---|
| ||||||||||
|
Anchor Fig-RTPP-BufferMemory-control-logic Fig-RTPP-BufferMemory-control-logic
| Div | ||||||||||
|---|---|---|---|---|---|---|---|---|---|---|
| ||||||||||
|
| Anchor | ||||
|---|---|---|---|---|
|
| Div | ||||||||||
|---|---|---|---|---|---|---|---|---|---|---|
| ||||||||||
|
| Div | ||||||||||
|---|---|---|---|---|---|---|---|---|---|---|
| ||||||||||
|

...
Lipkin, L.E., Watt, W.C., Kirsch, R.A.: The analysis, synthesis, and description of biological images. Ann N Y Acad Sci. 128(3): 984-1012, 1966.Anchor Lipkin66 Lipkin66
Lipkin, L.E., Lemkin, P.F., Carman, G.: Automated autoradiographic grain counting in human determined context. J. Histochem. Cytochem. 22(7): 755-765, 1974. (PDFAnchor Lipkin74 Lipkin74  )
)
Lemkin, P.F., Carman, G., Lipkin, L., Shapiro, B., Schultz, M., Kaiser, P.: A real time picture processor for use in biologic cell identification. I. System design. J. Histochem. Cytochem. 22(7): 725-731, 1974. (PDFAnchor RTPP-JHC-I-paper RTPP-JHC-I-paper )
Carman, G., Lemkin, P.F., Lipkin, L., Shapiro, B., Schultz, M., Kaiser, P.: A real time picture processor for use in biologic cell identification. II. Hardware implementation. J. Histochem. Cytochem. 22(7): 732-740, 1974. (PDFAnchor RTPP-JHC-II-paper RTPP-JHC-II-paper )
Shapiro, B., Lemkin, P.F., Lipkin, L.: The application of artificial intelligence techniques to biologic cell identification. J. Histochem. Cytochem. 22(7): 741-750, 1974. (PDFAnchor PRDL-ECR-paper PRDL-ECR-paper )
Schultz, M.L., Lipkin, L.E., Wade, M.J., Lemkin, P.F., Carman, G.M.: High resolution shading correction. J. Histochem. Cytochem.22(7): 751-754, 1974. (PDFAnchor Schultz74 Schultz74 )
Shapiro, H.M., Bryan, S.D., Lipkin, L.E., Stein, P.G., Lemkin, P.F.: Computer-aided microspectrophotometry of biological specimens. Exp Cell Res. 67(1): 81-89, 1971.Anchor Shapiro71 Shapiro71
Lemkin, P.F.: The boundary trace transform: An edge and region enhancement transform. Comp. Graphics Image Processing 9: 150-165, 1979.Anchor Lemkin79a Lemkin79a
Lemkin, P.F., Lipkin, L., Merril, C., Shiffrin, S.: Protein abnormalities in macrophages bearing asbestos. Environ. Health Perspect. 34: 5-89, 1980. (PDF)Anchor Lemkin80a Lemkin80a
Lipkin, L.E.: Cellular effects of asbestos and other fibers: correlations with in vivo induction of pleural sarcoma. Environ. Health Perspect. 34:91-102, 1980. (PDF)Anchor Lemkin80b Lemkin80b
Lemkin, P.F.: An approach to region splitting. Comp. Graphics Image Processing 10: 281-288, 1979.Anchor Lemkin79b Lemkin79b
Lemkin, P.F., Lipkin, L.: Use of the positive difference transform for RBC elimination in bone marrow smear images. Anal. Quant. Cytol. 1(1): 67-76, 1979.Anchor Lemkin79c Lemkin79c
Lemkin, P.F., Merril, C., Lipkin, L., Van Keuren, M., Oertel, W., Shapiro, B., Wade, M., Schultz, M., Smith, E.: Software aids for the analysis of 2D gel electrophoresis images. Comput. Biomed. Res. 12: 517-544, 1979.Anchor Lemkin79d Lemkin79d
Lester, E.P., Lemkin, P.F., Cooper, H.L., Lipkin, L.E.: Computer-assisted analysis of two-dimensional electrophoresis of human peripheral blood lymphocytes. Clin. Chem. 26: 1392-1402, 1980. (PDFAnchor Lemkin80c Lemkin80c )
Lipkin, L.E., Lemkin, P.F.: Data base techniques for multiple PAGE (2D gel) analysis. Clin. Chem. 26: 1403-1413, 1980. (PDFAnchor Lemkin80d Lemkin80d )
Lemkin, P.F., Lipkin, L.: GELLAB: A computer system for 2D gel electrophoresis analysis. I. Segmentation and preliminaries. Comput. Biomed. Res. 14: 272-297, 1981.Anchor Lemkin81a Lemkin81a
Lemkin, P.F., Lipkin, L.: GELLAB: A computer system for 2D gel electrophoresis analysis. II. Spot pairing. Comput. Biomed. Res. 14: 355-380, 1981.Anchor Lemkin81b Lemkin81b
Lemkin, P.F., Lipkin, L.: GELLAB: A computer system for 2D gel electrophoresis analysis. III. Multiple gel analysis. Comput. Biomed. Res. 14: 407-446, 1981.Anchor Lemkin81c Lemkin81c
Lester, E.P., Lemkin, P.F., Lipkin, L.E.: New dimensions in protein analysis - 2D gels coming of age through Image Processing. Anal. Chem. 53: 390A-397A, 1981.Anchor Lemkin81d Lemkin81d
Lester, E.P., Lemkin, P.F., Lipkin, L.E., Cooper, H.L.: A two-dimensional electrophoretic analysis of protein synthesis in resting and growing lymphocytes in vitro. J. Immunol. 126: 1428-1434, 1981.Anchor Lemkin81e Lemkin81e
Lemkin, P.F., Lipkin, L.E., Lester, E.P.: Some extensions to the GELLAB 2D electrophoresis gel analysis system. Clin. Chem. 28: 840-849, 1982. (PDFAnchor Lemkin82a Lemkin82a )
Lester, E.P., Lemkin, P.F., Lipkin, L.E.: A two-dimensional gel analysis of autologous T and B lymphoblastoid cell lines. Clin. Chem.28: 828-839, 1982. (PDFAnchor Lester82a Lester82a )
Lester, E.P., Lemkin, P.F., Lowery, J.F., Lipkin, L.E.: Human leukemias: A preliminary 2D electrophoretic analysis. Electrophoresis 3: 364-375, 1982.Anchor Lester82b Lester82b
Howard, R.J., Aley, S.B., Lemkin, P.F.: High resolution comparison of Plasmodium Knowlesi clones of different variant antigen phenotypes by 2D gel electrophoresis and computer analysis. Electrophoresis 4: 420-427, 1983.Anchor Howard83 Howard83
Lemkin, P.F., Lipkin, L.E.: 2D Electrophoresis gel data base analysis: Aspects of data structures and search strategies in GELLAB. Electrophoresis 4: 71-81, 1983.Anchor Lemkin83a Lemkin83a
Lester, E.P., Lemkin, P.F., Lipkin, L.E.: States of differentiation in leukemias: A 2D gel analysis. In Rowley, J. D. and Ultmann, J. E. (Eds.): Proceedings of 5th Annual Bristol Myers Symposium on Cancer Research. Chromosomes and Cancer: From Molecules to Man. New York, Academic Press, 1983, pp. 226-245.Anchor Lester83a Lester83a
Lemkin, P.F., Sonderegger, P., Lipkin, L.: Identification of coordinate pairs of polypeptides: A technique for screening of putative precursor product pairs in 2D gels.Clin. Chem. 30: 1965-1971, 1984. (PDFAnchor Lemkin84a Lemkin84a )
Lester, E.P., Lemkin, P F., Lipkin, L.E.: Protein indexing in leukemias and lymphomas. Ann. N.Y. Acad. Sci. 428: 158-172, 1984.Anchor Lester84a Lester84a
Sonderegger, P., Lemkin, P.F., Lipkin, L., Nelson, P.: Differential modulation of the expression of axonal proteins by non-neuronal cells and the peripheral and central nervous system. EMBO J. 4: 1395-1401, 1985. (PDF)Anchor Sonderegger85 Sonderegger85
Lemkin, P.F., Lipkin, L.E.: GELLAB: Multiple 2D electrophoretic gel analysis. In Allen, R. and Arnaud (Eds.): Electrophoresis '81. New York, W. De Gruyter, 1981, pp. 401-411.Anchor Lemkin81f Lemkin81f
Lemkin, P.F. , Lipkin, L.E.: Database techniques for 2D electrophoretic gel analysis. In Geisow, M. and Barrett, A. (Eds.): Computing in Biological Science. North Holland, Elsevier, 1983, pp. 181-226.Anchor Lemkin83b Lemkin83b
Lester, E.P., Lemkin, P.F.: A 'GELLAB' computer assisted 2D gel analysis of states of differentiation in hematopoietic cells. In Neuhoff, V. (Ed.): Electrophoresis '84. Chemie, Springer-Verlag, 1984, pp. 309-311.Anchor Lester84a Lester84a
Lemkin, P.F., Shapiro, B., Lipkin, L., Maizel, J., Sklansky, J., Schultz, M.: Preprocessing of electron micrographs of nucleic acid molecules for automatic analysis by computer. II. Noise removal and gap filling. Comput. Biomed. Res. 12: 615-630, 1979.Anchor Lemkin79d Lemkin79d
Lipkin, L., Lemkin, P.F., Shapiro, B., Sklansky, J.: Preprocessing of electron micrographs of nucleic acid molecules for automatic analysis by computer. Comput. Biomed. Res. 12: 279-289, 1979.Anchor Lipkin79b Lipkin79b
Shapiro, B., Lipkin L.: The circle transform, an articulable shape descriptor. Comput. Biomed. Res. 10: 511-28, 1977.Anchor Shapiro77a Shapiro77a
Shapiro, B.: Language processor generation with BNF inputs: methods and implementation. Comp. Programs. Biomedicine 7:85-98, 1977.Anchor Shapiro77b Shapiro77b
Shapiro, B., Pisa, J., Sklansky, J.: Skeletons from sequential boundary data. Proc. Intl. Conf. On Pattern Recognition and Image Processing. IEEE Comp. Soc. Press, Los Angeles, CA., 265-270, 1979.Anchor Shapiro79a Shapiro79a
Shapiro, B., Pisa, J., Sklansky, J.: Skeleton generation from xy boundary sequences. Comp. Vision Graphics Image Processing 15(2) 136-153, 1981.Anchor Shapiro81a Shapiro81a
Shapiro, B.S., Lipkin, L.E., Maizel, J.V.: Computerized generation of secondary structure maps for nucleic acids. Comp. Biomed. Res.12(6):545-568, 1979.Anchor Shapiro79b Shapiro79b
Lemkin, P.F., Lipkin, L.: BMON2 - A distributed monitor system for biological image processing. Computer Programs in Biomedicine 11: 21-42, 1980. (PDF)Reprinted from COMPUTER METHODS AND PROGRAMS IN BIOMEDICINE, Vol 11, Lemkin PD and LipkinL, BMON2 - A distributed monitor system for biological image processing, Pages 21-42, Copyright (1980), with permission from Elsevier.Anchor BMON2-CPIB-paper BMON2-CPIB-paper
Lipkin, B.S., Rosenfeld, A. (Eds): Picture Processing and Psychopictorics. Academic Press, New York, 1970, pps 526.Anchor Lipkin70 Lipkin70
Lemkin, P.F.: GELLAB-II: A workstation based 2D electrophoresis gel analysis system. In Endler, T. and Hanash, S. (Eds.): Proceedings of 2D Electrophoresis. West Germany, VCH Press, 1989, pp. 52-57. (This was the announcement of GELLAB-II)Anchor Lipkin89g Lipkin89g
Lemkin, P.F., Lester, E.P.: Database and search techniques for 2D gel protein data: A comparison of paradigms for exploratory data analysis and prospects for biological modeling. Electrophoresis 10(2): 122-140, 1989.Anchor Lipkin89h Lipkin89h
Robinson, M.K., Myrick, J.E., Henderson, L.O., Coles, C.D., Powell, M.K., Orr, G.A., Lemkin, P.F.: Two-dimensional protein electrophoresis and multiple hypothesis testing to detect potential serum protein biomarkers in children with fetal alcohol syndrome. Electrophoresis 16: 1176-1183, 1995.Anchor Robinson95 Robinson95
Stoeckli, E.T., Lemkin, P.F., Kuhn, T.B., Ruegg, M.A., Heller, M., Sonderegger, P.: Identification of proteins secreted from axons of embryonic dorsal-root-ganglia neurons. Eur. J. Biochem. 180: 249-258, 1989.Anchor Stoeckli89 Stoeckli89
Lemkin, P.F., Thornwall, G., Walton, K., Hennighausen, L: The Microarray Explorer tool for data mining of cDNA microarrays - application for the mammary gland, Nucleic Acids Res. 20(22): 4452-4459, 2000.Anchor Lemkin00a Lemkin00a
Shapiro, B.A.: An algorithm for comparing multiple RNA secondary structures. Comput. Appl. Biosci. 4(3): 387-393, 1988.Anchor Shapiro88 Shapiro88
Margalit, H., Shapiro, B.A., Oppenheim, A.B., Maizel, J.V. Jr.: Detection of common motifs in RNA secondary structures. Nucleic Acids Res. 17(12): 4829-4845, 1989.Anchor Margalit89 Margalit89
Le, S.Y., Owens, J., Nussinov, R., Chen, J.H., Shapiro, B., Maizel, J.V.: RNA secondary structures: comparison and determination of frequently recurring substructures by consensus. Comput. Appl. Biosci. 5(3): 205-210, 1989.Anchor Le89 Le89
Shapiro, B.A., Kasprzak, W.: STRUCTURELAB: a heterogeneous bioinformatics system for RNA structure analysis. J Mol. Graph.14(4): 194-205, 222-224, 1996.Anchor Shapiro96 Shapiro96
...
TR-2. Lemkin, P.F.: DDTG - Functional specification for the RTPP monitor. NCI/IP TR-2, 2-5-1976. NTIS Accession No. PB250726/AS, Springfield, VA, 1976, 90 pp. (Also in DECUS No. 8-823). (PDF)Anchor TR-2-report TR-2-report
TR-7. Lemkin, P.F., Carman, G., Lipkin, L., Shapiro, B., Schultz, M.: Real time picture processor: Description and specification. NCI/IP TR-7, 2-31-1976. NTIS Accession No. PB252268/AS, Springfield, VA, 1976, 139 pp. (PDF)Anchor TR-7-report TR-7-report
TR-7a. Lemkin, P.F.: Real Time Picture Processor: Description and specification. TR-7a, 6-23-1977. NTIS Accession No. PB269600/AS, Springfield, VA, 1977, 185 pp. (PDF TR-7a)Anchor TR-7a-report TR-7a-report
TR-8. Lemkin, P.F., Shapiro, B., Gordon, R., Lipkin, L.: PROC10 - An image processing system for the PDP10: Description and specification. NCI/IP TR-8, 12-16-1976. NTIS Accession No. PB261535/AS. Springfield, Va., 1976, 53 pp. (Also in DECUS No. 10-270). (PDF)Anchor TR-8-report TR-8-report
TR-15. Shapiro, B., Lemkin, P.F.: PRDL - Procedural Description Language. NCI/IP TR-15, 10-10-1977. NTIS Accession No. PB273112/AS Springfield, Va., 1977, 23 pp. (PDF)Anchor TR-15-report TR-15-report
TR-16. Lemkin, P.F., Shapiro, B., Schultz, M., Lipkin, L., Carman, G.: GPPASM - A PDP8e assembler for the General Picture Processor. NCI/IP TR-16, 12-15-1976. NTIS Accession No. PB261537/AS, Springfield, VA, 1976, 45 pp. (PDF)Anchor TR-16-report TR-16-report
TR-21. Lemkin, P.F.: Buffer memory monitor system for interactive image processing. NCI/IP TR-21, 3-31-1976. NTIS Accession No. PB261536/AS, Springfield, VA, 1976, 26 pp. (PDF)Anchor TR-21-report TR-21-report
TR21-b. Lemkin, P.F.: BMON2 - buffer memory monitor system for interactive image processing. NCI/IP TR-21b, 3-17-1978. NTIS Accession No. PB269642/AS, Springfield, VA, 1978, 112 pp. (PDF)Anchor TR-21b-report TR-21b-report
TR-22. Carman, G., Lemkin, P.F., Schultz, M., Lipkin, L., Shapiro, B.: Microprogram control architecture for the General Picture Processor. NCI/IP TR-22, 4-22-1977. NTIS Accession No. PB269762/AS, Springfield, VA, 1977, 35 pp. (PDF)Anchor TR-22-report TR-22-report
TR-23. Lemkin, P.F.: BMOMNI - Fortran interface program for the RTPP buffer memory, Quantimet and control desk. NCI/IP TR-23, 12-14-1976. NTIS Accession No. PB261538/AS, Springfield, VA, 1976, 10 pp. (PDF)Anchor TR-23-report TR-23-report
TR-472. Shapiro, B.: The use of orthogonal expansion for biological shape description. College Park, MD, University of Maryland Computer Science Center TR-472, Aug. 1976, pp 30. TR-653. Lemkin, P.F.: Bone marrow smear image analysis. College Park, MD, University of Maryland Computer Science Center TR-653, April, 1978, 156 pp. (PDF)Anchor TR-472-report TR-472-report
TR-655. Lemkin, P.F.: The run length map: A representation of contours and regions for efficient search and low level semantic encoding. College Park, MD, University of Maryland Computer Science Center TR-655, April, 1978, 60 pp. (PDF)Anchor TR-655-report TR-655-report
TR-BAS78. Shapiro, B.S.: "Shape description using boundary sequences", U. Maryland Computer Science Dept, 1978. (Ph.D. dissertation).Anchor TR-BAS78-report TR-BAS78-report
...
Overview
Content Tools
ThemeBuilder