
...
This history was compiled by Peter Lemkin with interviews, recollections, and content from Lewis Lipkin, George Carman, Bruce Shapiro, and Morton Shultz and some of the users (Carl Merril, Peter Sonderegger, Eric Lester). It could not have been done without everyone's input, which is reflected throughout the history. See the Acknowledgements for additional credits and information on online reference material donated as part of this history.Anchor top top
...
There are two major goals of this history: to document the events and conditions that led to the creation of one of the first grayscale image processors, and to describe the highly effective complementary collaboration that allowed this project to flourish. Occasionally, references will be made to other later advances indirectly related to the RTPP work that would not have happened without the RTPP. Where possible, we have linked to open access journal PDFs, and have included PDFs of the key technical reports describing the RTPP on this Web site.
...
The RTPP project was conceived and initiated by Dr. Lewis "Lew" Lipkin, M.D., head of the Image Processing Unit, later the Image Processing Section (IPS), in the the National Cancer Institute (NCI). The intellectual concept behind computer-controlled microscopy started in 1962 when Lew was an assistant professor of neuropathology at Downstate Medical Center in New York. Professor Patrick Fitzgerald, Chairman of the Pathology Department at Downstate, was studying pancreatic cell growth. Dr. Vinichaichol, who was doing visual grain counts on thin pancreatic sections, was finding mixed results. The problem was statistical. Dr. Lipkin was asked to design a proper sampling technique. Grain counting was a method used to measure cell metabolism before the days of antibody techniques applied to living cells and fluorescent techniques that came about during our time in NIH. Lew, who happened to know something about statistics, was asked by Dr. Fitzgerald to find out what was wrong with his statistics. After some thought, Lew realized that Dr. Vinichaichol was staying in one area of the slide and he had no way of knowing when he was recounting the same cells. Lew didn't want to continue looking at biological material that he couldn't explore without using some form of quantification.
...
The first thing he wanted to be able to do was move a slide via a computer-controlled microscope stage. Initially, he was going to do it with analog feedback. He talked to Wes Clark (who had helped build the LINC computer with Charlie Molner and others). Wes convinced Lew that he really wanted a digital stage - not an analog one - so that is what Lew developed: a series of stepping-motor-controlled stages that improved with each generation. The original design connected the stage with rubber bands, which was then greatly improved with direct stepping-motor drives. Lew had also been working with Russell Kirsch and Bill Watt from the National Bureau of Standards (NBS, now the National Institute of Standards and Technology or NIST ![]() ). This early work involved describing biological images using computer picture grammars [1] that attempted to bring artificial intelligence and algorithmic methods to the description of biological images.
). This early work involved describing biological images using computer picture grammars [1] that attempted to bring artificial intelligence and algorithmic methods to the description of biological images.
...
In 1968, I (Peter Lemkin) joined Lew's group to work on programming the LINC-8 along with Howard Shapiro of the PRB, and Russell Kirsch, Don Orser, and Phil Stein from the NBS who had been involved in the project. The first lab was in rental space in the Auburn Building across from the Bethesda Chevy Chase Rescue Squad where we would hear the fire trucks when they went out on a call. The group moved to the brand new Building 36 on the NIH Bethesda campus around 1970, which was a much better environment. (Building 36 was demolished in 2006.) The LINC-8 controlled a stepping-stage and a galvanometer scanner with a photomultiplier detector on a Leitz microscope, which was an early step in automated cytology [7]. It was very slow, but did offer high-quality 8-bit data. The problem was analysis power - in terms of scanning speed, CPU speed, image memory, analysis software, and analysis memory. It became clear that we did not have the hardware resources required to do complex image processing on the types of data we were determined to analyze. However, I learned to write hardware control software on the LINC-8 as it was truly a dedicated laboratory instrument computer ideal for connecting to laboratory equipment. This experience set the stage for the next generation of computer-controlled microscopes we tackled.
The second computer-controlled microscope project was the NCI grain counter [2] that is discussed in its own section. Advancements in electronics technology enabled us to design the grain counter using high-speed shift-register memory chips to capture X,Y coordinates from a 10 frame/second non-interlaced TV system ( Imanco Quantimet 720 ![]() ). Despite these advances, for larger image memories such as was needed for the RTPP, it would have been very difficult to implement image processing algorithms. This is because shift-register memory has delays in accessing any particular image pixel datum since the data must cycle around the circular shift register before the computer could access it. For complex algorithms with millions or billions of operations, this would be intolerable.
). Despite these advances, for larger image memories such as was needed for the RTPP, it would have been very difficult to implement image processing algorithms. This is because shift-register memory has delays in accessing any particular image pixel datum since the data must cycle around the circular shift register before the computer could access it. For complex algorithms with millions or billions of operations, this would be intolerable.
The culmination of these efforts was the Real Time Picture Processor (RTPP) described in journal papers [3, 4, 5, 6], as well as technical reports to be discussed and listed at the end of this history. We started this project just as the new Texas Instruments 4K bits X 1-bit dynamic RAMs (Random Access Memory - see history ofDRAM ![]() ) became available. Their availability was discovered by George Carman who proceeded to design the RTPP using these new chips. Many skilled people made this project possible: the superb computer hardware architecture work by George and the mechanical engineering work by Sprague Hazard; the coming together of the right group of people, with synergistic skills who got along as a family, at the right time when the technology and the NIH's support resources were available; the NCI's Director Seymour Perry and administrator Bill Penland gave us crucial encouragement and financial support. Dr. Perry invited us to move to NCI as the Image Processing Unit (IPU) about 1972. In projects of this type, there is a window of time when the technology is appropriate for the job. Without the 4K dynamic RAMs, the RTPP would not have been possible. We were doing cutting-edge research, but a year or two later, charge-coupled devices would make their appearance and eventually make much of our design obsolete. But that is the nature of progress.
) became available. Their availability was discovered by George Carman who proceeded to design the RTPP using these new chips. Many skilled people made this project possible: the superb computer hardware architecture work by George and the mechanical engineering work by Sprague Hazard; the coming together of the right group of people, with synergistic skills who got along as a family, at the right time when the technology and the NIH's support resources were available; the NCI's Director Seymour Perry and administrator Bill Penland gave us crucial encouragement and financial support. Dr. Perry invited us to move to NCI as the Image Processing Unit (IPU) about 1972. In projects of this type, there is a window of time when the technology is appropriate for the job. Without the 4K dynamic RAMs, the RTPP would not have been possible. We were doing cutting-edge research, but a year or two later, charge-coupled devices would make their appearance and eventually make much of our design obsolete. But that is the nature of progress.
...
One of the unique aspects of the RTPP was to implement the design as special-purpose parallel hardware with a flexible bus-architecture and a microcoded instruction set that reflected the types of operations routinely performed in image processing [3-4, TR-2, TR-7, TR-7a, TR-22]. Although other image processing computers were available, such as the ILLIAC-III ![]() , using a microcode architecture enabled an image processor to be constructed and built less expensively but with greater flexibility than building it entirely with discrete hardware. The special-purpose hardware could make real-time results possible (defined as reasonably fast enough to incorporate human feedback in tuning algorithms, such as interactively adjusting detection thresholds, etc.). A National Technical Information Service (NTIS)technical report [TR-7] describing the RTPP was one of the frequently requested reports one month as reported in their monthly newsletter for November 1976 under computer topics.
, using a microcode architecture enabled an image processor to be constructed and built less expensively but with greater flexibility than building it entirely with discrete hardware. The special-purpose hardware could make real-time results possible (defined as reasonably fast enough to incorporate human feedback in tuning algorithms, such as interactively adjusting detection thresholds, etc.). A National Technical Information Service (NTIS)technical report [TR-7] describing the RTPP was one of the frequently requested reports one month as reported in their monthly newsletter for November 1976 under computer topics.
Today, special digital signal processing (DSP) chips, very fast processors and memories perform this type of processing (used in video games, pocket cameras, and cell phones for example), rendering the original 1970s RTPP design obsolete. However, many of the concepts used in the RTPP design were unique and influenced other image processing hardware designs. As another example of this trend, confocal microscopy using a huge amount of image processing and memory is today routinely being done on small but powerful PC laboratory computers. Special-purpose hardware is no longer required.
The RTPP design was to be constructed in two stages: an image buffer memory subsystem, and later the General Picture Processor (GPP) [3-4, TR-2, TR-7, TR-7a, TR-16, TR-22]. The image memory was part of a grayscale digital image-capture system that was successfully used in various biology research areas to help analyze optical microscope images - both static and dynamic time-lapse, 2-dimensional (2D) electrophoretic gel images, and RNA electron micrographs of secondary structure, and other biological materials. It was used from about 1976 until it was decommissioned in 1984. For the second planned stage we had completed the design. However, the GPP was never constructed since high-speed computer technology was advancing rapidly and increasingly available to researchers, and it was difficult to justify additional research funds. The technology paradigm had shifted.
Scientists used the RTPP as finally constructed to analyze data in a variety of biomedical domains including optical microscope images of optical serial sections of brain tissue, stained bone marrow smears, and tissue cultures using phase contrast and differential interference optics. The latter was used in tracking cell membrane extents of macrophages in tissue culture over time as the cells tried to phagocytize various types of asbestos fibers. The goal was to better understand fiber carcinogenicity and the dynamics of fiber ingestion [8, 9, 10]. The bone marrow smear image analysis was part of my Ph.D. dissertation [11, 12, TR-653, TR-655]. The RTPP was also used for 2D electrophoretic gel images for a variety of biological materials [13, 14, 15, 16, 17, 18, 19, 20, 21, 22, 23, 24, 25, 26, 27, 28, 29, 30, 31, 32], and for RNA electron micrographs of secondary structure, which was part of Bruce Shapiro's Ph.D. dissertation [33, 34, 35, 36, 37, 38, TR-BAS78].

 Figure 1. Dr. Lewis Lipkin headed the project. His group started working on computer-controlled optical microscopy in the Perinatal Research Branch (PRB) of NINDB. The group later changed its name and institutes to the Image Processing Unit (IPU) in NCI in the Laboratory of Pathology. IPU later became the Image Processing Section (IPS) in NCI. The Section later became part of the Laboratory of Mathematical Biology (LMMB) in NCI under Dr. Charles DeLisi, Ph.D., and still later under Dr. Jacob Maizel, Ph.D.. The laboratory changed its name to the Laboratory of Experimental and Computational Biology (LECB) under Jake Maizel. The laboratory is currently refocused on nanobiology and is now called the Center for Computer Research Nanobiology Program (CCRNP) directed by Dr. Robert Blumenthal, Ph.D.(CCRNP has an additional research Web site).
...
| Anchor | ||||
|---|---|---|---|---|
|
...
| Div | ||||||||||
|---|---|---|---|---|---|---|---|---|---|---|
| ||||||||||
|

3. The NCI Autoradiograph Grain Counter: Precursor of the RTPP
The Real Time Picture Processor project was initiated after the successful completion of another project, the National Cancer Institute (NCI) autoradiograph grain counter [2]. This was one of the first computer-controlled microscopes (from the "NIH Record," about 1974). At the time, fluorescent antibodies were not commonly used for quantifying metabolism, so cell metabolism was often measured using autoradiography methods. When cells were grown in tissue culture with 3H-radiolabeled media, the radioactivity incorporated into cells could be used to estimate their metabolism. Dried slides of the cell culture sample were coated with photographic emulsion and exposed for weeks to months in the dark. They were then photographically developed making the silver grains embedded in the emulsion visible. Grains could be tracked and uniquely counted by serially focusing through the emulsion as individual grains were followed. The number of grains was proportional to the amount of 3H-radiolabeled media taken up by the cells and was a quantitative measurement of metabolism. The user would select a set of cells to be counted, adding them to the pick-list, and then let the machine automatically revisit the cells and make the grain counting measurements.
...
| Anchor | ||||
|---|---|---|---|---|
|
The plan was to have the NCI replicate these grain counter systems in three or four grantee laboratories. We had put out bids for the replication of the system. But, as with many technological break-throughs, the system worked, but better, less-expensive methods using new antibody and flow cytometry methods were becoming available. So autoradiography was replaced by other systems for measuring and quantifying specific cell types where tracking individual silver grains was not required. The additional grain counters were never built.
...
The block diagrams for this configuration are shown in Figures 4 and 5. The Quantimet was designed to perform simple binary thresholding of video analog data and counting operations on the non-interlaced analog video signal, but could not perform complex grayscale operations such as neighborhood computations. Later the RTPP/PDP8e system was interfaced to a DECsystem-2020 computer running the TOPS-10 operating system. Image acquisition and user interaction were relegated to the RTPP/PDP8e while complex analyses were done on the DECsystem-2020. Many of the figures illustrating the RTPP were drawn by Jo Abbott, our secretary and graphics draftsperson, during the initial design phase before we moved to the Park Building.
...
The Quantimet plumbicon analog video camera was attached to a computer-controlled Zeiss Axiomat microscope with (X,Y)-axes (0.5 micron/steps) Zeiss stepping-motor stage, and Z-axis focus (0.2 micron/step) stepping-motor controlled by the PDP8e. The anti-backlash Z-axis stepping-motor control-assembly was added with the help of Sprague Hazard (the same TDS consultant we had used with the grain counter project), and constructed by the NINDB machine shop. The advantage of Hazard's brilliant anti-backlash Z-axis design was that by moving past the point of interest and then reapproaching it from the same direction each time, one minimized mechanical hysteresis so that random accessed points of the slide could be repositioned quite reliably in three dimensions. Lew's idea of the slide as a 2D array information resource had been expanded to a 3D array (X,Y,Z). The Quantimet analog vidicon camera was used with regular 35mm camera lenses with a uniform illumination light-box for scanning 2D electrophoretograms, electron micrographs of RNA molecules, and other image sources (see figure 18). It was used with a variety of normal, wide-angle and macro-zoom lenses depending on the material we were investigating. The cameras could be easily switched. The plumbicon had a more linear and wider dynamic range and was better suited for microscopy.
...
The second phase of the RTPP was the design of a special-purpose 48-bit triple-operand, real-time computer processor called the General Picture Processor or GPP. This GPP would perform parallel image processing operations on 3x3 pixel neighborhoods in the buffer memory throughout the selected images. The GPP design had two input operands and one output operand. Each operand was assigned to an image buffer (there were sixteen 256x256 8-bit pixels per image buffer). The GPP included 3x3 pixel triple operand instructions, which would tessellate over the entire 256x256 pixel image space. The design is described in [3-4, TR-7, TR-7a, TR-22]. A software assembler for the GPP instruction set (GPPASM) [TR-16] and a debugger (DDTG) [TR-2] for the GPP were written on the PDP8e and ready to use with the hardware when it was built. The GPP hardware part of the RTPP was not completed due to a shift in NCI budget priorities. Considering the exponential increase over time in computing power of general-purpose microprocessors as well as their greatly decreasing cost, this was probably a wise decision. It became clear that software efforts would be more effective for many (but certainly not all!) problems. The paradigm had shifted.
The design of the RTPP was presented at the 1973 Asilomar Third Engineering Foundation Conference on Automated Cytology ![]() and published in 1974 [3-4]. This conference and a subsequent automated cytology workshop concentrated on the two solutions then available: image processing and pattern recognition of cell images, and the evolving field of flow cytometry. NIH was funding both fields. During this time we developed plans for integrating artificial intelligence techniques for understanding and analyzing biological materials and systems incorporating the RTPP, and these were also presented at the Asilomar workshop [5, TR-15].
and published in 1974 [3-4]. This conference and a subsequent automated cytology workshop concentrated on the two solutions then available: image processing and pattern recognition of cell images, and the evolving field of flow cytometry. NIH was funding both fields. During this time we developed plans for integrating artificial intelligence techniques for understanding and analyzing biological materials and systems incorporating the RTPP, and these were also presented at the Asilomar workshop [5, TR-15].
5.
| Anchor | ||||
|---|---|---|---|---|
|
The project was started about 1972. By this time, George Carman had left the National Institute of Neurological Disease and Blindness (NINDB), moved to Oregon and was working under contract with our National Cancer Institute (NCI) group. I had been working on a Ph.D. in computer science at the University of Maryland with specialization in image processing and so had Bruce Shapiro. So the General Picture Processor (GPP) design reflected many of the requirements of image processing methods. Lewis "Lew" Lipkin, with his broad understanding of image processing, was also heavily involved in the design. Lew, Bruce, and I would discuss the types of image processing operations we required in brain storming sessions. Then, George and I would have long phone-conversation design sessions where I described the image processing needs discussed in the local Image Processing Unit's group design sessions to George who then worked out the details on how to implement the required operations in the hardware design. I documented these design sessions, which resulted in the technical reports [TR-2, TR-7, TR-7a, TR-16, TR-21, TR-21b,TR-22].
The hardware system design was a joint effort with primary hardware electronics design by George Carman and primary software design by me. The RTPP electronics design was incrementally created in many hours-long phone conferences between George and myself discussing and negotiating requirements for image processing, possible implementations, implications of the designs for hardware and for software, etc. These long, detailed discussions reviewed and modified our snail-mailed blueprints and design documents (this was before e-mail and common access to the Internet). Our phone sessions allowed the iteration, refinement, and extension of the design to take into account the difficulty of programming the proposed hardware and the difficulty and expense of building the hardware. This joint design also allowed the IPU (me in particular) to start building the PDP8e software to interface with the hardware before the RTPP was delivered. In the end, both goals were optimized and the system worked. Some of this process was described in [3-4] and a few of the critical design ideas are listed in this history in some of the figures.
...
Once George wired and debugged one of the buffer image memory boards, we had a contractor, Cambion Corporation, build the remaining 63 boards (see an example of a board in figures 8 through 10 below). Each board consisted of 64 4K-bit dynamic RAMs (Random Access Memory chips). Four boards implemented a 256x256 pixel by two 8-bit bytes sub-image. These were among the first "high" density memory chips available at the time. Of course being the first generation of a high-density dynamic RAM chip, they had a high failure rate. So George built memory-testing software on the PDP8e that could pinpoint a bad chip on a particular board enabling us to unplug the bad chip and replace it with a new one. This saved a huge amount of time in finding the bad chips and helped improve uptime of the RTPP during its lifetime.
...
A more robust version of the control software was called BMON2 (Buffer Memory Monitor System) was written and used to interact with the RTPP. It integrated other programs and scripts that analyzed data from the RTPP [40, TR-21, TR-21b, TR-23]. BMON2 was written in Fortran-II under the PDP8e OS/8 operating system. As with the grain counter project, the ability to mix assembly language in with the Fortran allowed easy control of the more than 100 hardware instructions that we added to the RTPP controller (See [TR-7a] for details).
| Anchor | ||||
|---|---|---|---|---|
|
Under Lew's direction - and based on his long experience as a microscopist - the microscope concepts evolved over several generations of computer-controlled designs. The engineering machine shop in NINDB in Building 36 constructed the microscope assembly for the NCI grain counter project. They had an outstanding mechanical engineer consultant, Sprague Hazard, who previously solved some of the very tricky issues including removing the hysteresis in the Z-axis stepping-motor control for the grain counter microscope. He designed additional hardware for the microscope using anti-backlash gears with an approach similar of running the stepping motorsthat we had used in the grain counter. We used this method in the commercial X,Y microscope stepping-motor stage. He also designed a color-filter changer that implemented Lew's insistence on the importance of monochromatic light in micrographic analysis. The changer would swap interference filters in the light path. These successful experiences in constructing the grain counter were then leveraged when we built a new microscope around the Zeiss Axiomat for the RTPP - again with the help of Sprague Hazard who incorporated some very creative ideas.
...
The software control program for the buffer memory I constructed on the PDP8e was called BMON2 (the Buffer Memory Monitor System) [40, TR-21, TR-21b, TR-23] and written in Fortran-II. BMON2, in addition to interfacing with the RTPP, also allowed running other programs to be batched to analyze the data. Given that the PDP8e had 32K words of memory, this was critical for doing complex sequential operations and for easily writing new RTPP applications. A Fortran-II library that could interface with the RTPP, BMOMNI [TR-23], allowed these other programs to access the RTPP as required. (See discussion on Fortran-II in the section on the grain counter. This shows the BMOMNI Fortran code.) BMON2 could capture and display images and do many image processing operations on the PDP8e. Another program called FLICKER [13] ran on the PDP8e and was used to analyze 2D gel images visually by alternately displaying one movable image on the video screen relative to another that was held in a constant screen position. Later, it allowed the comparison of two saved images as well. So a set of images could be compared against a reference sample. Some of the ideas on using flickering images to detect subtle differences in image matching were suggested by Bernice Lipkin, who is an expert in psychopictorics [41]. A third-generation version of FLICKER is available as open-source software at http://open2dprot.sourceforge.net/Flicker ![]() .
.
...
For those interested in how we coded various image processing functions, we have an annotated list of the BMON2 Fortran-II programs and libraries. If you look at this, you might want also to take a look at the associated paper and technical reports on BMON2 which describe the design in more detail [40, TR-21, TR-21b, TR-23].
| Anchor | ||||
|---|---|---|---|---|
|
...
Many software analysis systems were developed using the RTPP, especially in the area of 2D gels with the GELLAB-I system [13, 14, 15, 16, 17, 18, 19, 20, 21, 22, 23,24, 25, 26, 27, 28, 29, 30, 31, 32], a 2D gel exploratory data analysis system integrating the image-processing with statistical databases for multiple samples (myself); and RNA electron micrographs of secondary structure [10, 11, 32, 39, 48, 49] (Bruce Shapiro). After the RTPP was decommissioned, GELLAB-I was redeveloped as a portable software system using Unix/C/X-windows and was called GELLAB-II [42, 43, 44, 45] (see Lemkin's History of GELLAB ![]() for more details, references, and history of GELLAB-II). Much of the work with GELLAB-I and GELLAB-II in exploratory data analysis led to its application to the DNA microarray domain (see http://maexplorer.sourceforge.net/
for more details, references, and history of GELLAB-II). Much of the work with GELLAB-I and GELLAB-II in exploratory data analysis led to its application to the DNA microarray domain (see http://maexplorer.sourceforge.net/ ![]() ) MAExplorer []. A third-generation instantiation of this data-mining system is part of the Open2Dprot open-source project at http://open2dprot.sourceforge.net/
) MAExplorer []. A third-generation instantiation of this data-mining system is part of the Open2Dprot open-source project at http://open2dprot.sourceforge.net/ ![]() with the goal of extending proteomics data mining to 2D LC-MS, protein-arrays. Bruce went on to develop other RNA analysis software [35, 39, 47, 48, 49, 50], leading to the StructureLab project [50] and related RNA structure analysis (see his RNA structure research group
with the goal of extending proteomics data mining to 2D LC-MS, protein-arrays. Bruce went on to develop other RNA analysis software [35, 39, 47, 48, 49, 50], leading to the StructureLab project [50] and related RNA structure analysis (see his RNA structure research group ![]() ).
).
...
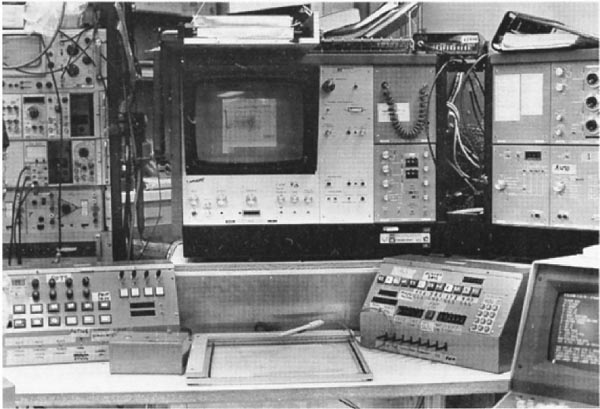
Some of the design details were unique to the Real Time Picture Processor at that era of computer designs. A few of these are illustrated in the following figures. The design is explained in more detail in references [3, 4] and in technical reports [TR-7, TR-7a, TR-23]. Figures 4 and 5 show block diagrams of the components of the system. Figures 6 and 7 show the interactive control desk that the operator used to interact with the PDP8e and thus the RTPP.
...
| Div | ||||||||||
|---|---|---|---|---|---|---|---|---|---|---|
| ||||||||||
|

...
| Div | ||||||||||
|---|---|---|---|---|---|---|---|---|---|---|
| ||||||||||
|

...
| Div | ||||||||||
|---|---|---|---|---|---|---|---|---|---|---|
| ||||||||||
|

...
...
During this time, we had the conviction, led by Lew Lipkin and George Carman, that anything that we wanted to be do in software could be done by a series of sequential gates. These could be proved Boolean algebraically correct using Karnaugh Maps![]() , hardware finite state machines, and related techniques. George had just taken a microprogramming design course as part of his masters degree in computer hardware architecture and the design of buffer memories and the General Picture Processor (GPP) were perfect test beds in which to try out these new design principles which were relatively new for projects like this. Some of the design diagrams are shown in Figures 11 through 14 (from the Carman [4] paper). Figure 15 shows some examples of GPP microprogrammed instructions for manipulating the buffer memory data. The design was further described in some of the technical reports [TR-7, TR-7a, TR-16, TR-21, TR-21b, TR-22] listed at the end of this history. Because we were prototyping the system, the card was constructed using wire wrapping rather than multilayer printed circuit boards. A commercial version would have used printed circuit boards, but would only have been economically feasible if many copies of the RTPP were produced. Using complex multi-level printed circuit boards is generally too expensive for a research lab.
, hardware finite state machines, and related techniques. George had just taken a microprogramming design course as part of his masters degree in computer hardware architecture and the design of buffer memories and the General Picture Processor (GPP) were perfect test beds in which to try out these new design principles which were relatively new for projects like this. Some of the design diagrams are shown in Figures 11 through 14 (from the Carman [4] paper). Figure 15 shows some examples of GPP microprogrammed instructions for manipulating the buffer memory data. The design was further described in some of the technical reports [TR-7, TR-7a, TR-16, TR-21, TR-21b, TR-22] listed at the end of this history. Because we were prototyping the system, the card was constructed using wire wrapping rather than multilayer printed circuit boards. A commercial version would have used printed circuit boards, but would only have been economically feasible if many copies of the RTPP were produced. Using complex multi-level printed circuit boards is generally too expensive for a research lab.
| Anchor | ||||
|---|---|---|---|---|
|
| Div | ||||||||||
|---|---|---|---|---|---|---|---|---|---|---|
| ||||||||||
|


...
| Div | ||||||||||
|---|---|---|---|---|---|---|---|---|---|---|
| ||||||||||
|


| Div | ||||||||||
|---|---|---|---|---|---|---|---|---|---|---|
| ||||||||||
|


...
| Div | ||||||||||
|---|---|---|---|---|---|---|---|---|---|---|
| ||||||||||
|


...
| Div | ||||||||||
|---|---|---|---|---|---|---|---|---|---|---|
| ||||||||||
|


| Div | ||||||||||
|---|---|---|---|---|---|---|---|---|---|---|
| ||||||||||
|


| Anchor | ||||
|---|---|---|---|---|
|


Figure 15. The Examples of RTPP instructions for the GPP (reproduced with permission from J. Histochem. Cytochem. [4], 1974). The Pi refers to a 3x3 pixel neighborhood that would be tessellated through the entire image. The GPP instructions [A HREF="#TR-22">TR-22] could be compiled by the GPPASM [A HREF="#TR-16">TR-16] assembler program running on the PDP8e and then loaded into the GPP instruction memory. A debugger for the GPP was DDTG that ran on the PDP8e [A HREF="#TR-2">TR-2] but controlled the GPP and buffer memories. We had also been evaluating collaborating on the construction of a MAINSAIL(R) Anchor Fig-RTPP-Examples-of-GPASM-code Fig-RTPP-Examples-of-GPASM-code ![]() compiler to generate GPP assembly code so we could program the RTPP in a SAIL-like language.
compiler to generate GPP assembly code so we could program the RTPP in a SAIL-like language.
...
We describe a few of the main applications that used the Real Time Picture Processor to give a little flavor of its utility. Other projects are referred to in some of the lists of journal articles, technical reports, and in the list of RTPP users towards the end of this article.
...
Lewis Lipkin was working on the cellular effects of asbestos fibers on the induction of pleural sarcoma [10]. Lew developed a culture system that used a macrophage-like P388D1 tissue cell line to study the effect of asbestos fibers on cells. Asbestos fibers were cytotoxic to the P388D1 macrophages in tissue cultures. A microscope system was used to take photographs of samples over multiple days to study fiber-induced cytotoxicity for a range of asbestos and related fibers as in Figure 16. On incubation, the colonies lost numbers of cells, and giant cells occurred in places. In addition, significant changes occurred in cell morphology. Marta Wade, the technician who ran the cell-lines, shot time-lapse photographs of the cells with various types of asbestos fibers. This type of data was among the first candidates for use with the RTPP image-capture system using both phase contrast and differential interference optics on the Zeiss Axiomat microscope. We also used this tissue culture system to when analyzing protein differences of these samples with 2D gels [9]. One of the offshoots of this work was to measure the uniformity of cell-boundary adherence using hundreds of images gathered in 15-second intervals. These were analyzed with the boundary trace transform (BTT) [8, 9] illustrated in Figure 17.
| Anchor | ||||
|---|---|---|---|---|
|
Another of the projects Lew and I were also working on was the construction of a 3D brain atlas of an anolus lizard brain using aligned microtomed serial-section images. (Some of the goals for that project were similar to that of the National Library of Medicine's Visible Human. However, this was well before adequate computer technology and resources were available to implement such an atlas.) We wrote a PDP8e program to move the optical microscope stage in (X,Y) while keeping the center of the brain in the scanned visual center of the image field as we switched slides in a series of microtomed serial sections (the Z-axis control was not used in this operation). Each centered image could then be captured and saved as a disk file. The next section visible on the TV camera was compared with the image previously captured and stored in the image buffer memory. This procedure was iteratively repeated with subsequent slides to capture a sequence of aligned serial sections from a set of slides. The buffer memory data was saved at each point on 9-track magnetic tape. (This alignment software subsequently led to our involvement with 2D electrophoretic gels analysis [discussed below].) The set of serial sections could then be re-accessed sequentially to step through the brain slices centered at the selected point. We could generate movie loops with the BMON2 software to move virtually up and down through the serial sections at various frame rates. Because we could store sixteen 256x256 images in the buffer memory, the loops could have up to 16 sections and allowed us to visualize the 3D structure of part of the brain.


| Anchor | ||||
|---|---|---|---|---|
|


Figure 17. (Left) Boundary trace transform (BTT) of 233 images of 15-second interval scans of a single living P388D1 macrophage-like cell (left) (reproduced with permission from Environmental Health Perspectives, 1980 [9]). The boundaries for this set of images were traced by hand using a graphics tablet connected to the RTPP. The BTT is a 2D boundary frequency histogram where darker (higher frequency) pixels indicate boundaries of the cell that are more adherent to the glass slide and have less motility. BMON2 captured the set of images data and double buffered them to 9-track magnetic tape, with a 15-second image-sampling interval between scans. (Right) Illustration of a single cell captured by the RTPP using differential interference optics. The algorithm is described in several papers [8, 9]. Movies were made on the RTPP of a subsequence of 16 of the images in which you could see the cell trying to ingest the fiber, the fiber breaking through the other side of the cell (membrane), and then the cell backing up to try to reingest that part of the fiber, etc. These images allowed us to create a probability distribution of adhesion strength for boundary points of amoeboid cells. Points with low probability would flutter and extend. Looking at individual boundaries would not reveal this type of information; it was the ability to integrate large quantities of data that allowed these patterns to be detected. This was the way we thought the system should have been used - finding interesting results when no other method for doing so was possible.
...
In about 1977, Carl Merril of the National Institutes of Mental Health (NIMH) had a problem. He was working with 2-dimensional (2D) gel electrophoresis to determine protein shifts in E.coliamber mutant cultures. However, just overlaying the gels on a light box did not show the differences very well, and he knew a difference should show up in the (MW, pIe) range of the gels. We had constructed a rudimentary flicker comparison program for acquiring aligned serial sections (describe above). A mutual friend, who played ping-pong with Carl, suggested that he contact us because we had this new system to do image processing. We jury-rigged the RTPP with a vidicon camera that could scan the 2D gel image using a 35 mm camera lens using the program we had developed to flicker align the anolus brain. The program kept the image just scanned in the buffer memory and the other was in the active video. By alternating one image against the other (i.e., flickering, similar to what we did in aligning anolus brain serial sections), we were able to immediately see the amber mutant proteins. Spots had shifted across to the other side of the gel, which is why their detection eluded simple observation. Part of this observation discovered in the gel differences was later validated in wet-lab experiments. At that point, we started developing a series of programs starting with the original FLICKER program reported in [13] and later leading to the GELLAB-I system (i.e., GEL LABoratory for exploratory data analysis).
The FLICKER software allowed users to measure spots as a set of (X,Y) image positions and integrated-densities for each sample. We manually recorded this data for later analysis, manually defining spots to be corresponding if they aligned well with FLICKER.


Figure 18. This was the alternative image acquisition setup. (Reproduced from a figure with permission from a reprint from Environmental Health Perspectives, 1980 [9].) A high-quality uniform illumination Aristo light box and Quantimet Vidicon TV camera were used for non-microscope images. A gel autoradiograph, wet 2D gel, electron micrograph, or other transparent sample object was placed on the light box and scanned using the RTPP/Vidicon camera. A NBS standard neutral density step wedge was placed on the bottom of the scan area. This was captured along with the image and was used to calibrate the grayscale pixel data to optical density using a piecewise linear curve fitting algorithm (see [9] for an example). As an aside, the electronics workbench area in the background was where many of the local RTPP electronics assembly was performed in the Park Building.Anchor lightBoxCameraStation lightBoxCameraStation
The manual recording of (gel,X,Y,intensity) data quickly became tedious and error prone as we increased the numbers of gels and numbers of spots measured. This led to an effort to automate the process. A spot segmenter was implemented on the PDP8e which used some of the image memories to store intermediate computations. Most of the time this process worked well, but occasionally a bit would be dropped in an image memory and the program would hang. A spot-pairing method was also implemented on the PDP8e. Around this time, the DECsystem-2020 interface became operational and the software was rewritten in SAIL (Stanford Artificial Intelligence Language) on the more robust DECsystem-2020 software system and became part of the GELLAB-I system [13, 14, 15, 16, 17, 18, 19, 20, 21, 22, 23, 24,25, 26, 27, 28, 29, 30, 31, 32]. The RTPP became a "front-end" for image processing software running on the DECsystem-2020, becoming a slave processor of the software on the DECsystem-2020. The GELLAB-I software then did data acquisition and interactive spot landmarking via the RTPP/BMON2 and subsequent higher level data analysis on the DECsystem-2020.
...
Eric painstakingly generated paired data for about 1,400 spots from the segmented images and their paired spot lists for a few gels. Because of the difficulty in matching or pairing spots between gels, I also developed spot-pairing and spot "landmarking" programs, which ran interactively on the RTPP/PDP8e. (Landmarking is visually identifying a set of spots that are common in both the reference gel and each additional gel sample so spot pairing could proceed.) Eric then subjected the data to SPSS ![]() statistical analysis with encouraging results (t-Tests, Spearman correlation, ANOVA) and it was published in [14] and enhancements in [15,18-21]. All three of these programs were rewritten in SAIL for the DECsystem-2020. At this point we realized that we wanted to build a database containing large numbers of gels to detect marker proteins or classify samples by protein pattern signatures indicating states of differentiation, disease conditions, or other experimental conditions. This was the basis of GELLAB-I.
statistical analysis with encouraging results (t-Tests, Spearman correlation, ANOVA) and it was published in [14] and enhancements in [15,18-21]. All three of these programs were rewritten in SAIL for the DECsystem-2020. At this point we realized that we wanted to build a database containing large numbers of gels to detect marker proteins or classify samples by protein pattern signatures indicating states of differentiation, disease conditions, or other experimental conditions. This was the basis of GELLAB-I.
This led to the SAIL program CGELP, in GELLAB-I, to construct a composite gel database with a virtual reference gel [14-18,20,30] and the addition of many more statistical methods. (The subsequent Unix version was called CGELP2 [30, 42, 43, 44, 45] where additional statistical exploratory data analysis methods were added - see [history of GELLAB ![]() ].) Spots of a set of N-1 gels would be matched to one of the gels called a reference gel and spots missing in the physical reference gel would be extrapolated into the reference gel. Figure 19 shows the reference gel 324.1 that was an acute myeloid leukemia (AML) gel, scanned with the RTPP. This reference gel was used in many of the leukemia databases to tie the data together [14, 15, 16, 17, 18, 22]. The collection of SAIL programs, as well as their RTPP interface, was called GELLAB-I. After leaving NIH (for the University of Chicago), Eric would fly back to work in our laboratory to do marathon late-night landmarking sessions to help generate these databases of large numbers of 2D leukemia gels. Over the years, we had built various databases with over 400 gel samples. The leukemia database had over 130 samples. Some of these gel sample images are available on the bioinformatics.org/lecb2dgeldb
].) Spots of a set of N-1 gels would be matched to one of the gels called a reference gel and spots missing in the physical reference gel would be extrapolated into the reference gel. Figure 19 shows the reference gel 324.1 that was an acute myeloid leukemia (AML) gel, scanned with the RTPP. This reference gel was used in many of the leukemia databases to tie the data together [14, 15, 16, 17, 18, 22]. The collection of SAIL programs, as well as their RTPP interface, was called GELLAB-I. After leaving NIH (for the University of Chicago), Eric would fly back to work in our laboratory to do marathon late-night landmarking sessions to help generate these databases of large numbers of 2D leukemia gels. Over the years, we had built various databases with over 400 gel samples. The leukemia database had over 130 samples. Some of these gel sample images are available on the bioinformatics.org/lecb2dgeldb ![]() open source repository. This early research led to my interest in exploratory data analysis and future work with microarrays with MAExplorer.sourceforge.net
open source repository. This early research led to my interest in exploratory data analysis and future work with microarrays with MAExplorer.sourceforge.net ![]() [46], and proteomics exploratory data analysis using open2dprot.sourceforge.net
[46], and proteomics exploratory data analysis using open2dprot.sourceforge.net ![]() .
.
Peter Sonderegger, while a post-doc at the National Institute of Child Health and Development (NICHD), used the GELLAB-I system with the RTPP to investigate how the expression of axonal proteins of sensory and motor neurons was influenced by non-neuronal cells [27, 29, 45]. At the same time we were investigating the feasibility of porting GELLAB-I (written in SAIL) to the PASCAL computer language. The inflexibility of PASCAL eventually led us to convert GELLAB-I to the portable C/UNIX/X-windows environment called GELLAB-II [42, 43, 44, 45] The DECsystem-10 SAIL version, GELLAB-I, was exported to research labs at Univ. of Chicago (Eric Lester) and Univ. of Kiel (Heinz Busse). The Unix version, GELLAB-II, was exported to a number of research labs around the world (CDC with Jim Myrick [44], Univ. Zurich with Peter Sonderegger, Agr. Univ. Norway with Trygve Krekling, and others) and led to a commercial subset version for Windows PCs called GELLAB-II++ by CSPI/Scanalytics.


| Anchor | ||||
|---|---|---|---|---|
|
...
In the mid 1970s, Jacob Maizel (who later became chief of the Laboratory of Experimental and Computational Biology) visited the Image Processing Unit (IPU) carrying a set of electron micrographs of RNA molecules. While in the National Institute of Child Health and Development (NICHD), Jake had been using an early Hewlett Packard computer to manually trace the RNA molecules in the electron micrographs to determine the repetitive nature of features that were visible in these images. The traces, called secondary structure maps, indicated where double- and single-stranded regions occurred in the RNA. Knowledge of these regions is important for understanding RNA folding, which in turn is related to RNA's function. This manual task was tedious and Jake wondered whether the image processing hardware and software associated with the RTPP could be used to help generate secondary structure maps automatically. The RTPP was used to scan and preprocess some of these electron micrograph images [33, 34] that were input for this type of analysis. At the same time, Bruce had developed the circle transform [35] for biological shape description for describing cell mitosis with Lew and had published with Dr. Jack Sklansky, Ph.D. [37, 38], who was doing a sabbatical in the IPU at the time. Bruce became interested in the RNA folding problem after working on these shape descriptors for the cellular image domain.
This work led to a series of programs that were able to analyze digital images of the electron micrographs (see Figure 20) by applying algorithms such as shade correction to reduce background noise irregularities, notch filtering, and segmentation to extract the shapes of the individual molecules. The circle transform was then applied to these shapes to produce secondary structure maps [39]. They produced several papers [47, 48, 49, 50, TR-472] as well as Bruce's Ph.D. dissertation [TR-BAS78] under Azriel Rosenfeld at the University of Maryland. Bruce went on to do research on other aspects of RNA structure and function (see www.ccrnp.ncifcrf.gov/~bshapiro), including the use of RNA in nanobiology.
Partly as a result of this collaboration, Jake became more interested in computing, which led him to purchase one of the early DEC VAX computers for his lab. As Jake became more involved with computational techniques, he realized the general importance, as did Lew, of using computers in biology. Eventually, this interest culminated with the National Cancer Institute's purchase of a Cray XMP supercomputer, and the establishment of what is today the Advanced Biomedical Computer Center in Frederick. The Cray XMP, at that time, was the first supercomputer in the world solely dedicated to biomedical research. Thus, the impact of the RTPP continues to be felt in the biological computation sciences 30 years later.
| Anchor | ||||
|---|---|---|---|---|
|


Figure 20. One of the early RNA electron micrographs scanned with the vidicon/RTPP system (Jacob Maizel, Bruce Shapiro, and Lewis Lipkin) [33, 34, 39, 48, 49]. The sample was adenovirus type 2 messenger RNA. Bruce developed boundary segmenters and boundary shape descriptors that could map electron micrograph data to the secondary structure.
...
Since many of the companies and products mentioned in this article have disappeared, we found historical links on the Internet that were useful for providing the context in which to understand this project. When the history was completed, it was donated to the Museum of NIH in the Office of NIH History (http://history.nih.gov/) for use as part of their permanent online exhibits. We also wish to thank them for their help. A buffer memory image board from the original RTPP, selected papers and technical reports illustrating the design were also donated as artifacts. Many of the papers are available as PDF links to the journals, and most of the technical reports are available as downloadable PDF files in the References section of this Web site. The Office of NIH History has permanent exhibits as well as access to these artifacts.
...
Lipkin, L.E., Watt, W.C., Kirsch, R.A.: The analysis, synthesis, and description of biological images. Ann N Y Acad Sci. 128(3): 984-1012, 1966.Anchor Lipkin66 Lipkin66
Lipkin, L.E., Lemkin, P.F., Carman, G.: Automated autoradiographic grain counting in human determined context. J. Histochem. Cytochem. 22(7): 755-765, 1974. (PDFAnchor Lipkin74 Lipkin74  )
)
Lemkin, P.F., Carman, G., Lipkin, L., Shapiro, B., Schultz, M., Kaiser, P.: A real time picture processor for use in biologic cell identification. I. System design. J. Histochem. Cytochem. 22(7): 725-731, 1974. (PDFAnchor RTPP-JHC-I-paper RTPP-JHC-I-paper )
Carman, G., Lemkin, P.F., Lipkin, L., Shapiro, B., Schultz, M., Kaiser, P.: A real time picture processor for use in biologic cell identification. II. Hardware implementation. J. Histochem. Cytochem. 22(7): 732-740, 1974. (PDFAnchor RTPP-JHC-II-paper RTPP-JHC-II-paper )
Shapiro, B., Lemkin, P.F., Lipkin, L.: The application of artificial intelligence techniques to biologic cell identification. J. Histochem. Cytochem. 22(7): 741-750, 1974. (PDFAnchor PRDL-ECR-paper PRDL-ECR-paper )
Schultz, M.L., Lipkin, L.E., Wade, M.J., Lemkin, P.F., Carman, G.M.: High resolution shading correction. J. Histochem. Cytochem.22(7): 751-754, 1974. (PDFAnchor Schultz74 Schultz74 )
Shapiro, H.M., Bryan, S.D., Lipkin, L.E., Stein, P.G., Lemkin, P.F.: Computer-aided microspectrophotometry of biological specimens. Exp Cell Res. 67(1): 81-89, 1971.Anchor Shapiro71 Shapiro71
Lemkin, P.F.: The boundary trace transform: An edge and region enhancement transform. Comp. Graphics Image Processing 9: 150-165, 1979.Anchor Lemkin79a Lemkin79a
Lemkin, P.F., Lipkin, L., Merril, C., Shiffrin, S.: Protein abnormalities in macrophages bearing asbestos. Environ. Health Perspect. 34: 5-89, 1980. (PDF)Anchor Lemkin80a Lemkin80a
Lipkin, L.E.: Cellular effects of asbestos and other fibers: correlations with in vivo induction of pleural sarcoma. Environ. Health Perspect. 34:91-102, 1980. (PDF)Anchor Lemkin80b Lemkin80b
Lemkin, P.F.: An approach to region splitting. Comp. Graphics Image Processing 10: 281-288, 1979.Anchor Lemkin79b Lemkin79b
Lemkin, P.F., Lipkin, L.: Use of the positive difference transform for RBC elimination in bone marrow smear images. Anal. Quant. Cytol. 1(1): 67-76, 1979.Anchor Lemkin79c Lemkin79c
Lemkin, P.F., Merril, C., Lipkin, L., Van Keuren, M., Oertel, W., Shapiro, B., Wade, M., Schultz, M., Smith, E.: Software aids for the analysis of 2D gel electrophoresis images. Comput. Biomed. Res. 12: 517-544, 1979.Anchor Lemkin79d Lemkin79d
Lester, E.P., Lemkin, P.F., Cooper, H.L., Lipkin, L.E.: Computer-assisted analysis of two-dimensional electrophoresis of human peripheral blood lymphocytes. Clin. Chem. 26: 1392-1402, 1980. (PDFAnchor Lemkin80c Lemkin80c )
Lipkin, L.E., Lemkin, P.F.: Data base techniques for multiple PAGE (2D gel) analysis. Clin. Chem. 26: 1403-1413, 1980. (PDFAnchor Lemkin80d Lemkin80d )
Lemkin, P.F., Lipkin, L.: GELLAB: A computer system for 2D gel electrophoresis analysis. I. Segmentation and preliminaries. Comput. Biomed. Res. 14: 272-297, 1981.Anchor Lemkin81a Lemkin81a
Lemkin, P.F., Lipkin, L.: GELLAB: A computer system for 2D gel electrophoresis analysis. II. Spot pairing. Comput. Biomed. Res. 14: 355-380, 1981.Anchor Lemkin81b Lemkin81b
Lemkin, P.F., Lipkin, L.: GELLAB: A computer system for 2D gel electrophoresis analysis. III. Multiple gel analysis. Comput. Biomed. Res. 14: 407-446, 1981.Anchor Lemkin81c Lemkin81c
Lester, E.P., Lemkin, P.F., Lipkin, L.E.: New dimensions in protein analysis - 2D gels coming of age through Image Processing. Anal. Chem. 53: 390A-397A, 1981.Anchor Lemkin81d Lemkin81d
Lester, E.P., Lemkin, P.F., Lipkin, L.E., Cooper, H.L.: A two-dimensional electrophoretic analysis of protein synthesis in resting and growing lymphocytes in vitro. J. Immunol. 126: 1428-1434, 1981.Anchor Lemkin81e Lemkin81e
Lemkin, P.F., Lipkin, L.E., Lester, E.P.: Some extensions to the GELLAB 2D electrophoresis gel analysis system. Clin. Chem. 28: 840-849, 1982. (PDFAnchor Lemkin82a Lemkin82a )
Lester, E.P., Lemkin, P.F., Lipkin, L.E.: A two-dimensional gel analysis of autologous T and B lymphoblastoid cell lines. Clin. Chem.28: 828-839, 1982. (PDFAnchor Lester82a Lester82a )
Lester, E.P., Lemkin, P.F., Lowery, J.F., Lipkin, L.E.: Human leukemias: A preliminary 2D electrophoretic analysis. Electrophoresis 3: 364-375, 1982.Anchor Lester82b Lester82b
Howard, R.J., Aley, S.B., Lemkin, P.F.: High resolution comparison of Plasmodium Knowlesi clones of different variant antigen phenotypes by 2D gel electrophoresis and computer analysis. Electrophoresis 4: 420-427, 1983.Anchor Howard83 Howard83
Lemkin, P.F., Lipkin, L.E.: 2D Electrophoresis gel data base analysis: Aspects of data structures and search strategies in GELLAB. Electrophoresis 4: 71-81, 1983.Anchor Lemkin83a Lemkin83a
Lester, E.P., Lemkin, P.F., Lipkin, L.E.: States of differentiation in leukemias: A 2D gel analysis. In Rowley, J. D. and Ultmann, J. E. (Eds.): Proceedings of 5th Annual Bristol Myers Symposium on Cancer Research. Chromosomes and Cancer: From Molecules to Man. New York, Academic Press, 1983, pp. 226-245.Anchor Lester83a Lester83a
Lemkin, P.F., Sonderegger, P., Lipkin, L.: Identification of coordinate pairs of polypeptides: A technique for screening of putative precursor product pairs in 2D gels.Clin. Chem. 30: 1965-1971, 1984. (PDFAnchor Lemkin84a Lemkin84a )
Lester, E.P., Lemkin, P F., Lipkin, L.E.: Protein indexing in leukemias and lymphomas. Ann. N.Y. Acad. Sci. 428: 158-172, 1984.Anchor Lester84a Lester84a
Sonderegger, P., Lemkin, P.F., Lipkin, L., Nelson, P.: Differential modulation of the expression of axonal proteins by non-neuronal cells and the peripheral and central nervous system. EMBO J. 4: 1395-1401, 1985. (PDF)Anchor Sonderegger85 Sonderegger85
Lemkin, P.F., Lipkin, L.E.: GELLAB: Multiple 2D electrophoretic gel analysis. In Allen, R. and Arnaud (Eds.): Electrophoresis '81. New York, W. De Gruyter, 1981, pp. 401-411.Anchor Lemkin81f Lemkin81f
Lemkin, P.F. , Lipkin, L.E.: Database techniques for 2D electrophoretic gel analysis. In Geisow, M. and Barrett, A. (Eds.): Computing in Biological Science. North Holland, Elsevier, 1983, pp. 181-226.Anchor Lemkin83b Lemkin83b
Lester, E.P., Lemkin, P.F.: A 'GELLAB' computer assisted 2D gel analysis of states of differentiation in hematopoietic cells. In Neuhoff, V. (Ed.): Electrophoresis '84. Chemie, Springer-Verlag, 1984, pp. 309-311.Anchor Lester84a Lester84a
Lemkin, P.F., Shapiro, B., Lipkin, L., Maizel, J., Sklansky, J., Schultz, M.: Preprocessing of electron micrographs of nucleic acid molecules for automatic analysis by computer. II. Noise removal and gap filling. Comput. Biomed. Res. 12: 615-630, 1979.Anchor Lemkin79d Lemkin79d
Lipkin, L., Lemkin, P.F., Shapiro, B., Sklansky, J.: Preprocessing of electron micrographs of nucleic acid molecules for automatic analysis by computer. Comput. Biomed. Res. 12: 279-289, 1979.Anchor Lipkin79b Lipkin79b
Shapiro, B., Lipkin L.: The circle transform, an articulable shape descriptor. Comput. Biomed. Res. 10: 511-28, 1977.Anchor Shapiro77a Shapiro77a
Shapiro, B.: Language processor generation with BNF inputs: methods and implementation. Comp. Programs. Biomedicine 7:85-98, 1977.Anchor Shapiro77b Shapiro77b
Shapiro, B., Pisa, J., Sklansky, J.: Skeletons from sequential boundary data. Proc. Intl. Conf. On Pattern Recognition and Image Processing. IEEE Comp. Soc. Press, Los Angeles, CA., 265-270, 1979.Anchor Shapiro79a Shapiro79a
Shapiro, B., Pisa, J., Sklansky, J.: Skeleton generation from xy boundary sequences. Comp. Vision Graphics Image Processing 15(2) 136-153, 1981.Anchor Shapiro81a Shapiro81a
Shapiro, B.S., Lipkin, L.E., Maizel, J.V.: Computerized generation of secondary structure maps for nucleic acids. Comp. Biomed. Res.12(6):545-568, 1979.Anchor Shapiro79b Shapiro79b
Lemkin, P.F., Lipkin, L.: BMON2 - A distributed monitor system for biological image processing. Computer Programs in Biomedicine 11: 21-42, 1980. (PDF)Reprinted from COMPUTER METHODS AND PROGRAMS IN BIOMEDICINE, Vol 11, Lemkin PD and LipkinL, BMON2 - A distributed monitor system for biological image processing, Pages 21-42, Copyright (1980), with permission from Elsevier.Anchor BMON2-CPIB-paper BMON2-CPIB-paper
Lipkin, B.S., Rosenfeld, A. (Eds): Picture Processing and Psychopictorics. Academic Press, New York, 1970, pps 526.Anchor Lipkin70 Lipkin70
Lemkin, P.F.: GELLAB-II: A workstation based 2D electrophoresis gel analysis system. In Endler, T. and Hanash, S. (Eds.): Proceedings of 2D Electrophoresis. West Germany, VCH Press, 1989, pp. 52-57. (This was the announcement of GELLAB-II)Anchor Lipkin89g Lipkin89g
Lemkin, P.F., Lester, E.P.: Database and search techniques for 2D gel protein data: A comparison of paradigms for exploratory data analysis and prospects for biological modeling. Electrophoresis 10(2): 122-140, 1989.Anchor Lipkin89h Lipkin89h
Robinson, M.K., Myrick, J.E., Henderson, L.O., Coles, C.D., Powell, M.K., Orr, G.A., Lemkin, P.F.: Two-dimensional protein electrophoresis and multiple hypothesis testing to detect potential serum protein biomarkers in children with fetal alcohol syndrome. Electrophoresis 16: 1176-1183, 1995.Anchor Robinson95 Robinson95
Stoeckli, E.T., Lemkin, P.F., Kuhn, T.B., Ruegg, M.A., Heller, M., Sonderegger, P.: Identification of proteins secreted from axons of embryonic dorsal-root-ganglia neurons. Eur. J. Biochem. 180: 249-258, 1989.Anchor Stoeckli89 Stoeckli89
Lemkin, P.F., Thornwall, G., Walton, K., Hennighausen, L: The Microarray Explorer tool for data mining of cDNA microarrays - application for the mammary gland, Nucleic Acids Res. 20(22): 4452-4459, 2000.Anchor Lemkin00a Lemkin00a
Shapiro, B.A.: An algorithm for comparing multiple RNA secondary structures. Comput. Appl. Biosci. 4(3): 387-393, 1988.Anchor Shapiro88 Shapiro88
Margalit, H., Shapiro, B.A., Oppenheim, A.B., Maizel, J.V. Jr.: Detection of common motifs in RNA secondary structures. Nucleic Acids Res. 17(12): 4829-4845, 1989.Anchor Margalit89 Margalit89
Le, S.Y., Owens, J., Nussinov, R., Chen, J.H., Shapiro, B., Maizel, J.V.: RNA secondary structures: comparison and determination of frequently recurring substructures by consensus. Comput. Appl. Biosci. 5(3): 205-210, 1989.Anchor Le89 Le89
Shapiro, B.A., Kasprzak, W.: STRUCTURELAB: a heterogeneous bioinformatics system for RNA structure analysis. J Mol. Graph.14(4): 194-205, 222-224, 1996.Anchor Shapiro96 Shapiro96
...
TR-2. Lemkin, P.F.: DDTG - Functional specification for the RTPP monitor. NCI/IP TR-2, 2-5-1976. NTIS Accession No. PB250726/AS, Springfield, VA, 1976, 90 pp. (Also in DECUS No. 8-823). (PDF)Anchor TR-2-report TR-2-report
TR-7. Lemkin, P.F., Carman, G., Lipkin, L., Shapiro, B., Schultz, M.: Real time picture processor: Description and specification. NCI/IP TR-7, 2-31-1976. NTIS Accession No. PB252268/AS, Springfield, VA, 1976, 139 pp. (PDF)Anchor TR-7-report TR-7-report
TR-7a. Lemkin, P.F.: Real Time Picture Processor: Description and specification. TR-7a, 6-23-1977. NTIS Accession No. PB269600/AS, Springfield, VA, 1977, 185 pp. (PDF TR-7a)Anchor TR-7a-report TR-7a-report
TR-8. Lemkin, P.F., Shapiro, B., Gordon, R., Lipkin, L.: PROC10 - An image processing system for the PDP10: Description and specification. NCI/IP TR-8, 12-16-1976. NTIS Accession No. PB261535/AS. Springfield, Va., 1976, 53 pp. (Also in DECUS No. 10-270). (PDF)Anchor TR-8-report TR-8-report
TR-15. Shapiro, B., Lemkin, P.F.: PRDL - Procedural Description Language. NCI/IP TR-15, 10-10-1977. NTIS Accession No. PB273112/AS Springfield, Va., 1977, 23 pp. (PDF)Anchor TR-15-report TR-15-report
TR-16. Lemkin, P.F., Shapiro, B., Schultz, M., Lipkin, L., Carman, G.: GPPASM - A PDP8e assembler for the General Picture Processor. NCI/IP TR-16, 12-15-1976. NTIS Accession No. PB261537/AS, Springfield, VA, 1976, 45 pp. (PDF)Anchor TR-16-report TR-16-report
TR-21. Lemkin, P.F.: Buffer memory monitor system for interactive image processing. NCI/IP TR-21, 3-31-1976. NTIS Accession No. PB261536/AS, Springfield, VA, 1976, 26 pp. (PDF)Anchor TR-21-report TR-21-report
TR21-b. Lemkin, P.F.: BMON2 - buffer memory monitor system for interactive image processing. NCI/IP TR-21b, 3-17-1978. NTIS Accession No. PB269642/AS, Springfield, VA, 1978, 112 pp. (PDF)Anchor TR-21b-report TR-21b-report
TR-22. Carman, G., Lemkin, P.F., Schultz, M., Lipkin, L., Shapiro, B.: Microprogram control architecture for the General Picture Processor. NCI/IP TR-22, 4-22-1977. NTIS Accession No. PB269762/AS, Springfield, VA, 1977, 35 pp. (PDF)Anchor TR-22-report TR-22-report
TR-23. Lemkin, P.F.: BMOMNI - Fortran interface program for the RTPP buffer memory, Quantimet and control desk. NCI/IP TR-23, 12-14-1976. NTIS Accession No. PB261538/AS, Springfield, VA, 1976, 10 pp. (PDF)Anchor TR-23-report TR-23-report
TR-472. Shapiro, B.: The use of orthogonal expansion for biological shape description. College Park, MD, University of Maryland Computer Science Center TR-472, Aug. 1976, pp 30. TR-653. Lemkin, P.F.: Bone marrow smear image analysis. College Park, MD, University of Maryland Computer Science Center TR-653, April, 1978, 156 pp. (PDF)Anchor TR-472-report TR-472-report
TR-655. Lemkin, P.F.: The run length map: A representation of contours and regions for efficient search and low level semantic encoding. College Park, MD, University of Maryland Computer Science Center TR-655, April, 1978, 60 pp. (PDF)Anchor TR-655-report TR-655-report
TR-BAS78. Shapiro, B.S.: "Shape description using boundary sequences", U. Maryland Computer Science Dept, 1978. (Ph.D. dissertation).Anchor TR-BAS78-report TR-BAS78-report
...
Overview
Content Tools
ThemeBuilder